Over the past few decades, evangelicals in America have discussed and debated how to make our churches more ethnically diverse. The missiologist Paul Hiebert said a multiethnic church is “a church in which there is (1) an attitude and practice of accepting people of all ethnic, class, and national origins as equal and fully participating members and ministers in the fellowship of the church; and (2) the manifestation of this attitude and practice by the involvement of people from different ethnic, social and national communities as members in the church.”
Many of our churches strive to achieve these objectives. But one question is often overlooked: “What would ethnic diversity look like in my local church?”
While we desire to be multiethnic, we often don’t know how to measure how near or far we are to meeting that objective. Too often the crude metric for determining church diversity is “census quota”—the assumption that each racial and ethnic group should be represented within a church in percentages that correspond to their representation in the broader United States. For example, to take only racial categories, the percentages for all U.S. adults are: White (non-Latino), 66 percent; Black, 12 percent; Latino, 15 percent; Asian, 4 percent; Mix/Other, 4 percent.
If census quota were the ideal it would mean that 100 percent of the churches in America would be predominately white, since 66 percent of the population is white. That’s not usually what people think of when they think of diversity.
The census quota metric also fails to account for regional differences. The ethnic and racial composition of a rural town in South Dakota will be much different from inner-city Baltimore. This is why a one-size-fits-all standard will not work for every church.
In this article I want to focus on how we might measure the “manifestation of this attitude and practice.” The method I propose is not the only way to measure church diversity, nor is it likely to be the best approach. But it has the advantage of being simple, practical, and doable by anyone armed with an internet connection, a spreadsheet, and a church directory.
The 15-Minute Outreach Rule
Because geography is a primary factor in diversity, the first step is to determine the ethnic demographics of your community. But what exactly constitutes our geographical community and the extent of the outreach we can expect? A helpful gauge is the “15-minute outreach rule”: expect the majority of your congregation will spend 15 minutes or less traveling to your church.
Census data show about 21 percent of churchgoers say their commute is 5 minutes or less, while almost half (47 percent) say it takes them 6 to 15 minutes to get to church. Only 23 percent commute 16 to 30 minutes, while less than 10 percent have a drive longer than 30 minutes to get to church. A study by Baylor University also found that half of Americans who live within 15 minutes of their place of worship report attending services weekly or more.
Use a map tool (such as this one) to draw a 15-mile radius around your church address. This will show you the maximum possible reach if people could travel at 60 miles an hour in a straight line to get to your location. The maximum is not the actual, though, so you’ll need to narrow this area by testing locations on another mapping tool (such as Google Maps) to determine what is actually possible based on realistic commute times.
(This assumes the congregation will drive to church. If you live in an urban area you will need to determine the time it takes for a church commute by walking or using public transportation.)
Know Your Demographics
Next, type your church’s zip code into this USPS tool to find the other zip codes in your area of outreach. For each zip code the USPS provides useful demographic information, including racial makeup. But to get a broader ethnic breakdown I recommend looking directly at the Census data. Go to the Census Bureau’s American Fact Finder page and enter a zip code in your outreach area. Scroll down and click on “2016 American Community Survey > Demographic and Housing Estimates” to get the latest data. Repeat this step for every applicable zip code.
On this table you can find not only broad racial categories (e.g., Asian), but also numerous ethnic groups within those categories (i.e., Chinese, Filipino, and so on). Copy this information for each zip code into a spreadsheet to tabulate the ethnic composition of your area.
Measure Members, Not Visitors
Using the methods listed above, we now have an accurate—albeit crude and somewhat incomplete—metric for determining the ethnic composition of our community. The next step is to measure the internal diversity of your church.
There are two reasons to measure only church members. The first is that you’re likely to have more accurate demographic information about your members than your visitors. You may already know the ethnic composition of your members, but if not you can acquire such information using a simple online survey.
The second reason is that there may be a divergence between “attitude” and “manifestation.” Your congregation may appear to be racially and ethnically diverse on Sunday morning, but there’s a disconnect if they are not showing up in your membership roles. If you sing worship songs in Spanish and the sermon is in Korean and yet have few members who are Hispanic or Asian, you’re likely doing something wrong.
Consider Denominational Realities
Should we expect the demographics of our churches to be identical to our community? Not necessarily. We should also consider other factors, such as how our denominational affiliation may affect our local diversity.
For example, in my zip code the population is 52 percent white, 33 percent Asian, 7 percent black, and 7 percent Hispanic. However, in my denomination (Southern Baptist Convention), 6 percent are black, 3 percent are Hispanic, and less than 1 percent are Asian. While it might be realistic to expect 6 percent to 10 percent of my one-year-old church plant to be black and Hispanic, can I really expect one-third to be Asian? Probably not, at least not without several more years of hard work.
While it might be a worthy long-term objective to have 33 percent of my church be Asian Americans, an SBC church composed of only 15 percent to 20 percent would still be admirably multiethnic. The same would be true for an African Methodist Episcopal Church congregation that was 15 percent white and Hispanic. Denominational realities shouldn’t constrain our outreach efforts, but they should make us more patient about what is possible in the short term.
By applying this approach, you will be able to better gauge your current level of ethnic diversity in both your church and also your community. You may realize there’s a broader or narrower degree of diversity in your outreach area than you had imagined. You may also be surprised to find your church is doing unexpectedly better (or worse) in reaching some groups than with others. You won’t know all you need to know about the diversity of your church, but you’ll have gained a more accurate perspective on how you are reaching your community.
Is there enough evidence for us to believe the Gospels?
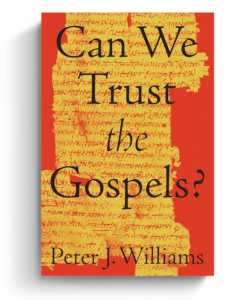 In an age of faith deconstruction and skepticism about the Bible’s authority, it’s common to hear claims that the Gospels are unreliable propaganda. And if the Gospels are shown to be historically unreliable, the whole foundation of Christianity begins to crumble.


